Patreon Team Analytics
The DDH Team Hub
The Team Hub Google Sheet is a comprehensive, daily-updated dashboard that provides a deep dive into the trajectory of the NHL season.
Playoff Probabilities and Standings Projections:
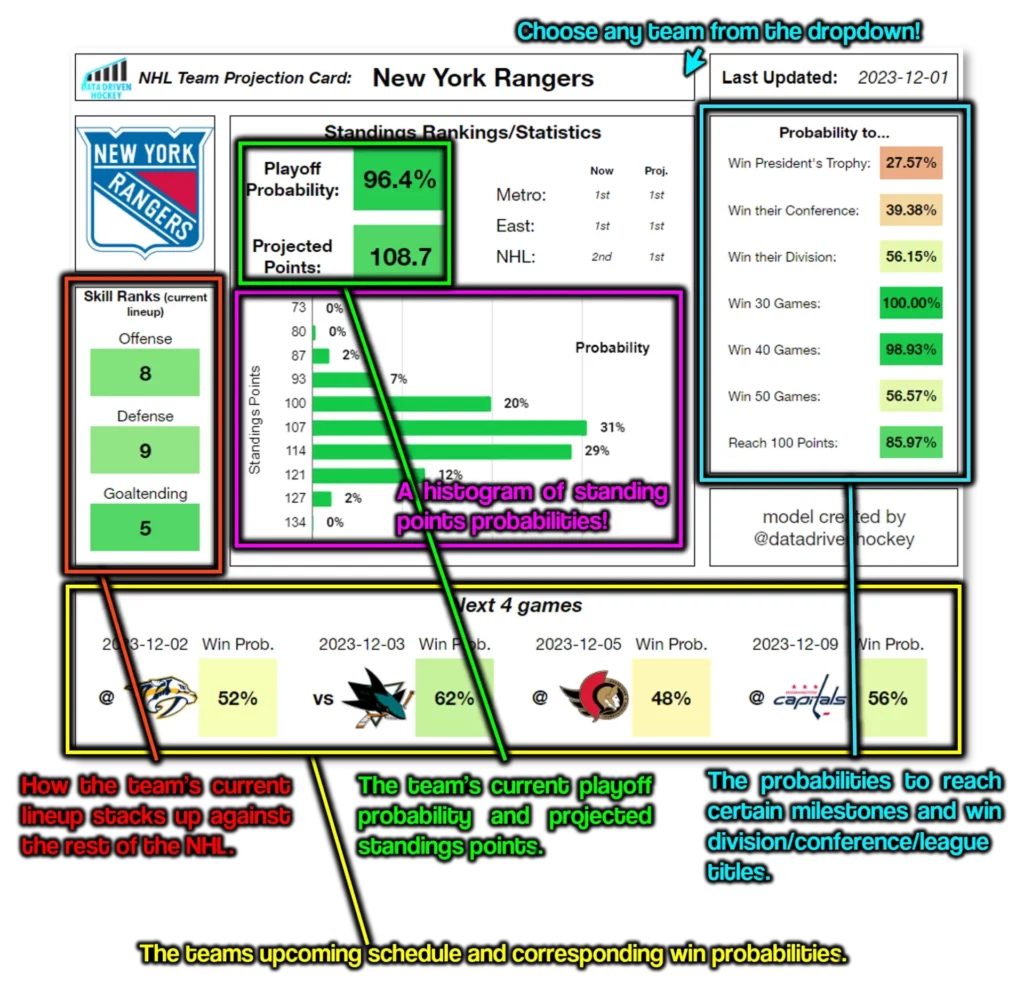
The playoff probability/standings projection model is run overnight, every night. It simulates the remainder of the NHL season 10,000 times, thus capturing the full breadth of possible outcomes. In the Team Hub you can see each NHL team’s projected wins, losses and overtime losses as well as their probability of qualifying for the playoffs, winning the presidents trophy and coming first in their conference and division.

Team Projection Cards:
The team projection cards offer a more granular look at the projections by concisely summarizing the range of possible season outcomes for each NHL team.

Probability Trackers:
Track how teams playoff probability has changed over the course of the NHL season.

Power Rankings:
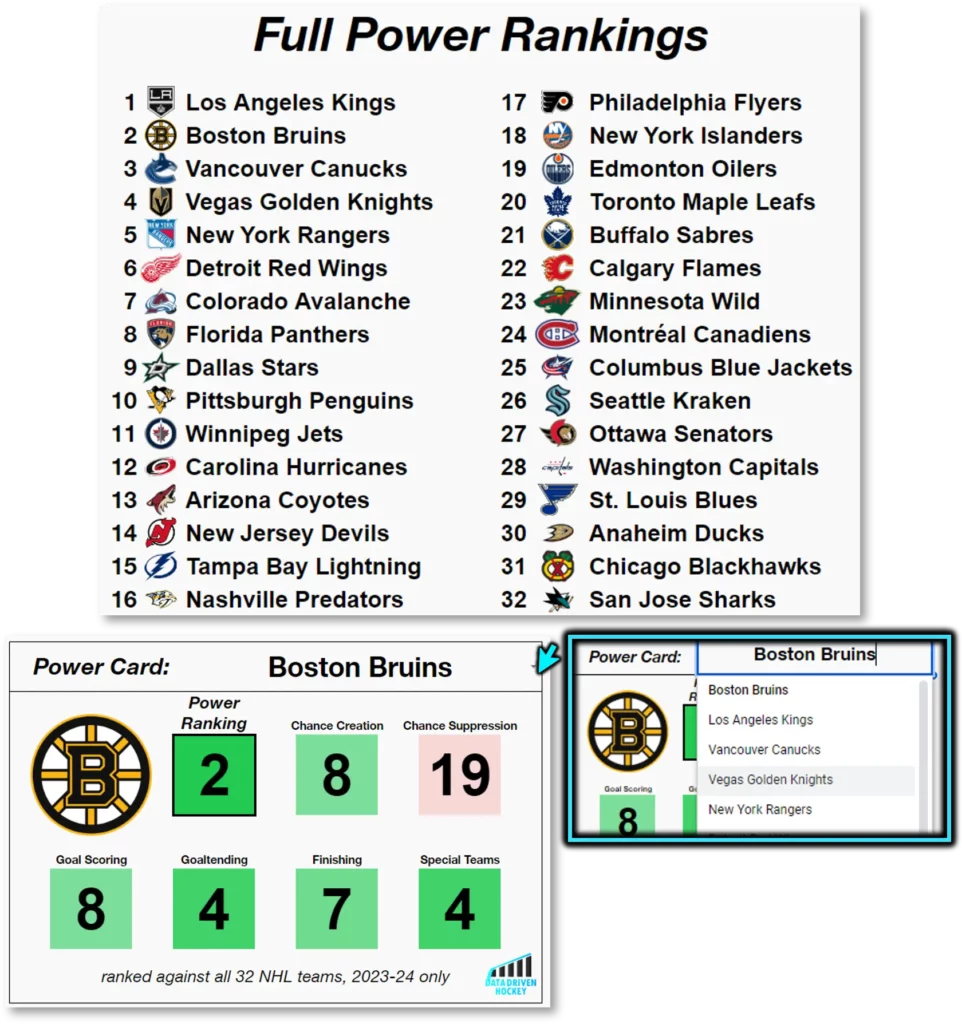
These power rankings are different than the season projections. The season projections predict who will make the playoffs, whereas the power rankings predict who will perform best in the playoffs. The rankings are the output of my power rankings model. The model is a multi-layer perceptron neural network (sci-kit learn MLPRegressor). The model was validated using a 16-fold cross validation, which produced a mean test score of 0.61.

Fun Stat Rankings:
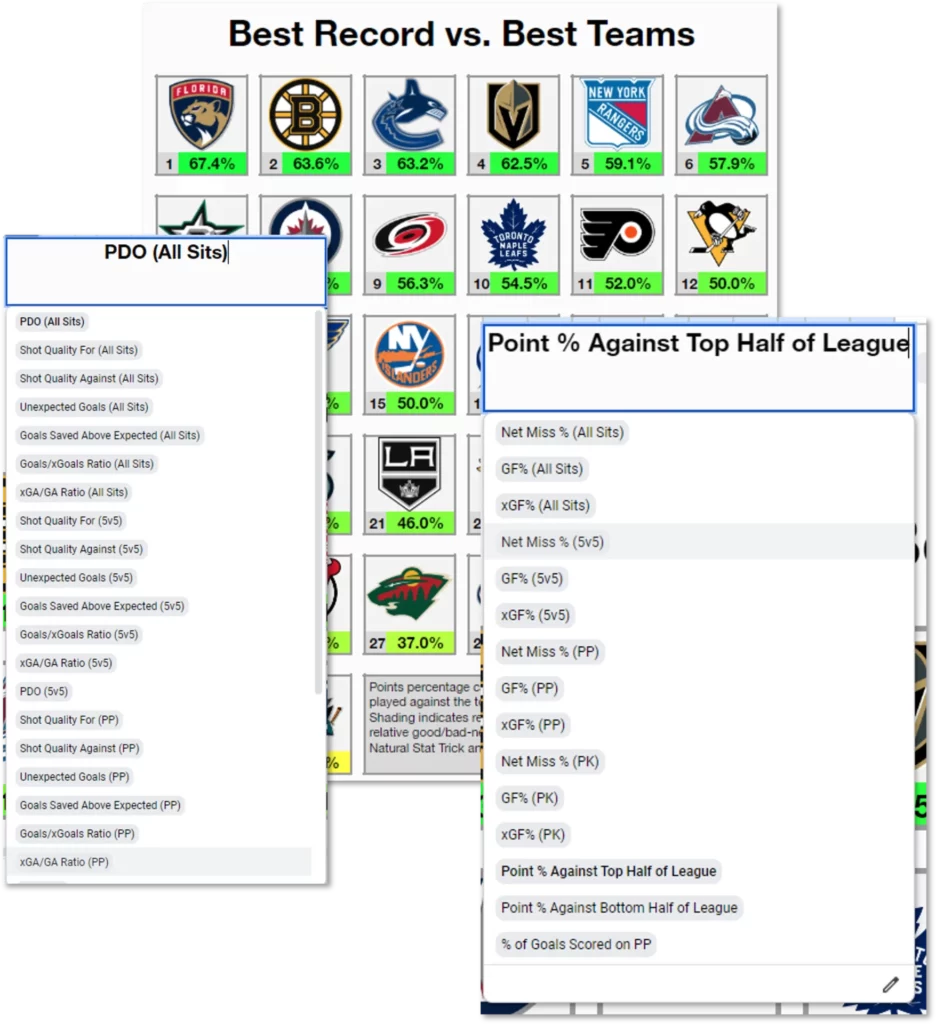
See which teams lead the league (and which teams are on the bottom) in a ton of interesting stats, many of which you can’t find anywhere else!

