
Patreon Benefits Explained
The DataDrivenHockey Patreon provides enhanced access to the data, rankings, and model outputs featured on social media. Patreon is a platform that allows creators like me to offer exclusive content to their supporters, who subscribe for a monthly fee. By becoming a patron, you directly support my work and gain access to special perks.
The Patreon tiers (levels of membership) are listed in the table of benefits below. Each subsequent tier includes all benefits included in the previous tiers. Click a tier to jump to that section, or click a specific tool/perk to jump to its description and instructions.
Table of Benefits
- Expected Goal Scorer Tier – 8.50 USD/month
- Expected Goal Scorer Pro Tier – 14.00 USD/month
- Expected Goal Scorer Elite Tier – 20.00 USD/month
Access the Benefits
- Access the “Expected Goal Scorer Perks” Folder (Any Patreon member)
- Access the Value Vault (Expected Goal Scorer Elite members only)
- Get a Fantasy Hub Pro (Expected Goal Scorer Pro/Elite members only)
- Get a Game Probability Hub Pro (Expected Goal Scorer Pro/Elite members only)
Expected Goal Scorer Tier
8.50 USD/month
All the benefits included in this tier are available in the Expected Goal Scorer Perks Google Drive folder. Access to this folder is gained via the pinned post on Patreon (see the *Access the Benefits* section above).
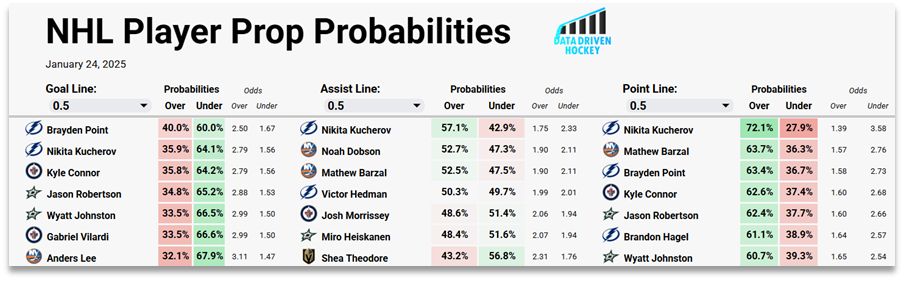
Daily NHL Game and Player Prop Probabilities
Daily NHL game probabilities from GPM2, updated every 3 hours to include the latest lineup and starting goalie information available.
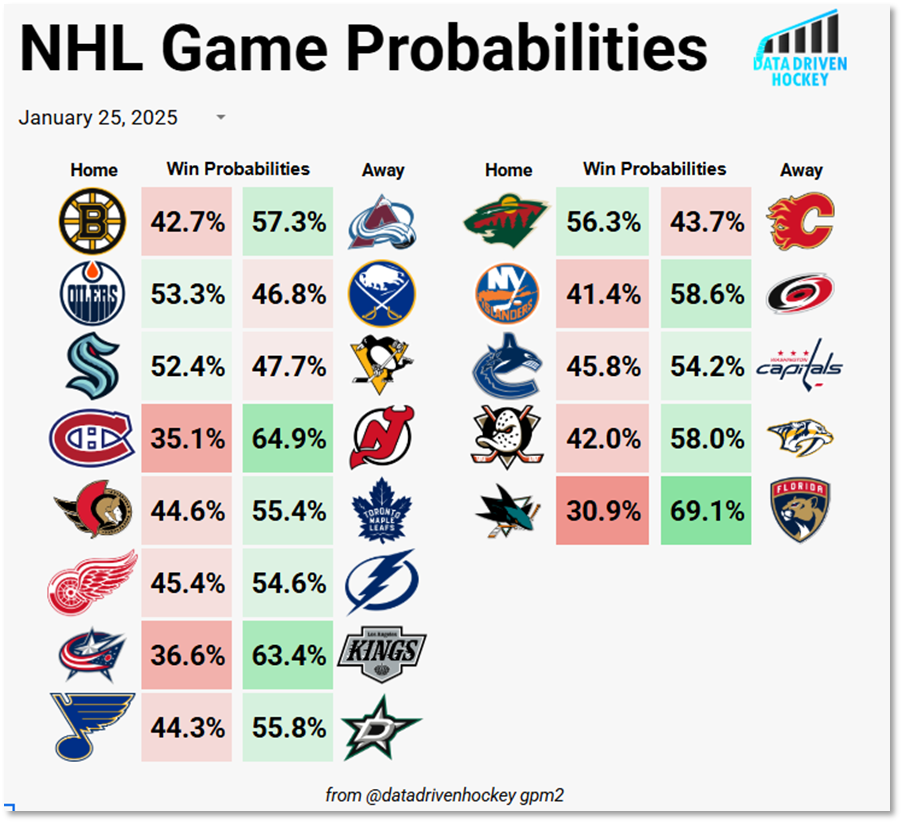
Daily probabilities include:
- Game win probabilities
- Skater prop probabilities for goals, assists, points, shots and blocks
- Regulation win probabilities
- Overtime/Shootout win probabilities
- Total and individual team goal probabilities
- Puck line probabilities
- Total and individual team shot probabilities
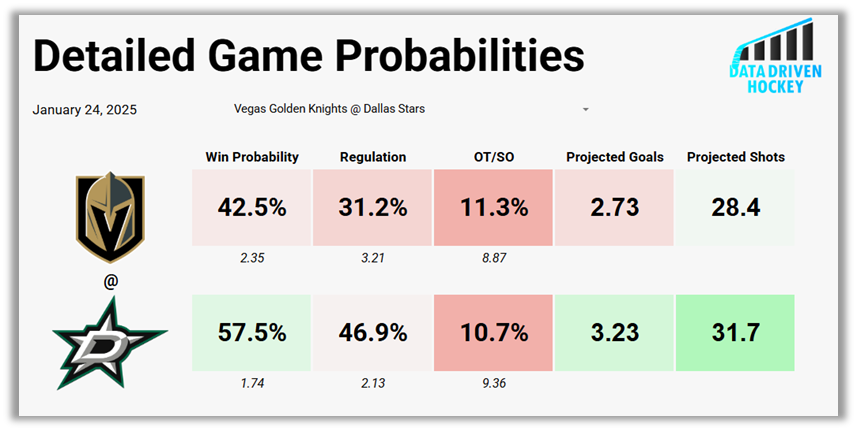
Both the Game Probability Hub Google Sheet and the DataDrivenHockey website can be used to view the daily NHL probabilities.
Parlay Builders
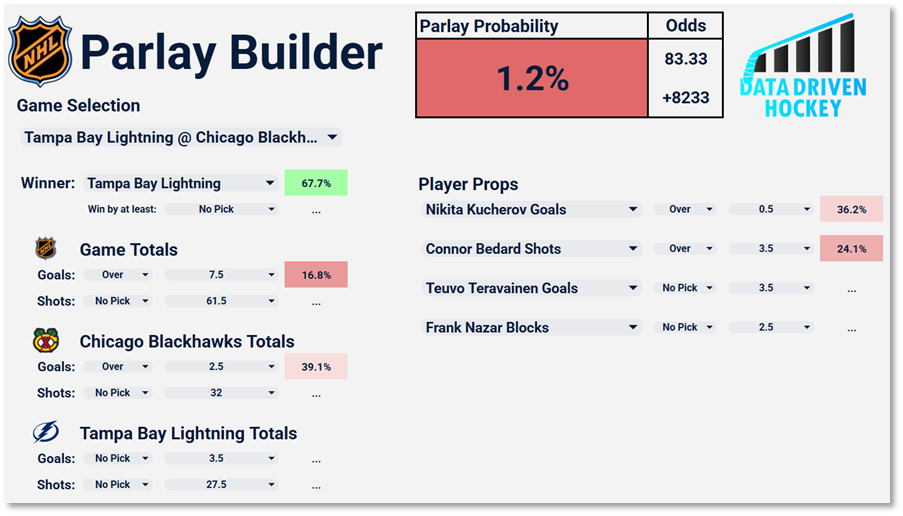
The parlay builders allow you to calculate same-game parlay probabilities using the GPM2 probability projections. The parlay probability calculated by the parlay builder accounts for the statistical dependence of events that occur in an NHL game, so it is not the same as the probability of multiplying two individual ‘leg’ probabilities together. The image below shows a small same-game parlay that illustrates this concept.
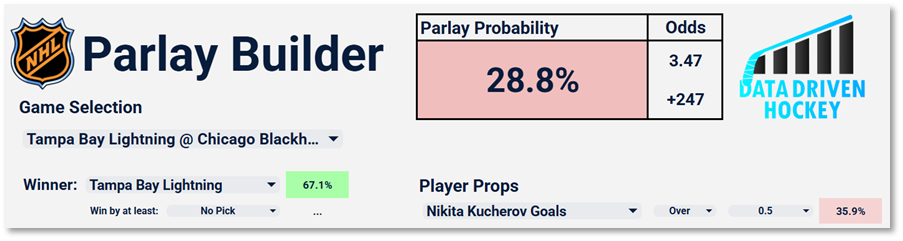
The probability for a single leg of the parlay hitting is displayed on the far right of the individual leg entry. Multiplying 67.1% (Tampa’s win probability) by 35.9% (Kucherov’s goal probability) yields a probability of 24%. However, the parlay builder has calculated a probability of 28.8% because these events are not independent → Kucherov scoring (or not scoring) impacts the probability that Tampa will win.
You can calculate multi-game parlay probabilities by multiplying the probabilities of multiple same-game parlays, because individual games are statistically independent.
How to use the Parlay Builders
There are four Parlay Builders in the Expected Goal Scorer Perks folder, labelled Parlay Builder A through D. Parlay Builder A holds data for the first four games of the day, B holds data for the next 4, etc. Each Parlay Builder has 5 sheets and they all have the exact same functionality.
Below is an image of the parlay builder interface and here are the steps for building a parlay…
- Select which game you want to build a parlay for in the Game Selection drop-down field.
- Select a potential winner from the Winner dropdown field. You will have the option to select “No Pick” if you don’t want to include a game winner pick in the parlay.
- In the Game Totals and Team_Name Totals sections you specify lines and over/unders for goals and shots. These sections have 2 fields; in the first field you specify the type of prop bet by choosing “Over”, “Under” or “No Pick” and in the second field you specify the number that you want the stat (goals or shots) to be over or under. For example, in the Game Totals section in the image below “Goals over 7.5” is selected and “No Pick” is specified in the first Shots field, so the 61.5 in the second Shots field is ignored.
- In the Player Props section, you begin by searching for a player and stat type in the dropdown (you can search by keyboard to avoid scrolling through all the players in that particular game). The next steps are the same as the previous section, specify the type (“Over”, “Under” or “No Pick”) and then the actual number that you want the stat to be over or under. If you select “No Pick” in any section it will be ignored.
Parlay Builder Tips
- When you change your game selection NO OTHER SELECTIONS WILL CHANGE. This can lead to some strangeness:
- Players not playing in the newly selected game will remain in the player props section. Those particular player props will be ignored by the Parlay Builder probability calculations until switched to valid choices for the newly selected game.
- If a Winner was selected for the previous game, its probability field will now read 100%. The Parlay Builder probability calculation will not be impacted, but it is best to choose a new winner or “No Pick”.
- The Parlay Builders contain a massive amount of data and thus can run quite slowly. For the best experience access the Parlay Builders with a computer or high-spec tablet. You may occasionally need to refresh the Parlay Builder to prompt it to perform calculations.
Fantasy Hub
The Fantasy Hub is a google sheet that contains multiple tools for fantasy hockey success. Its is updated with the latest available data every morning.
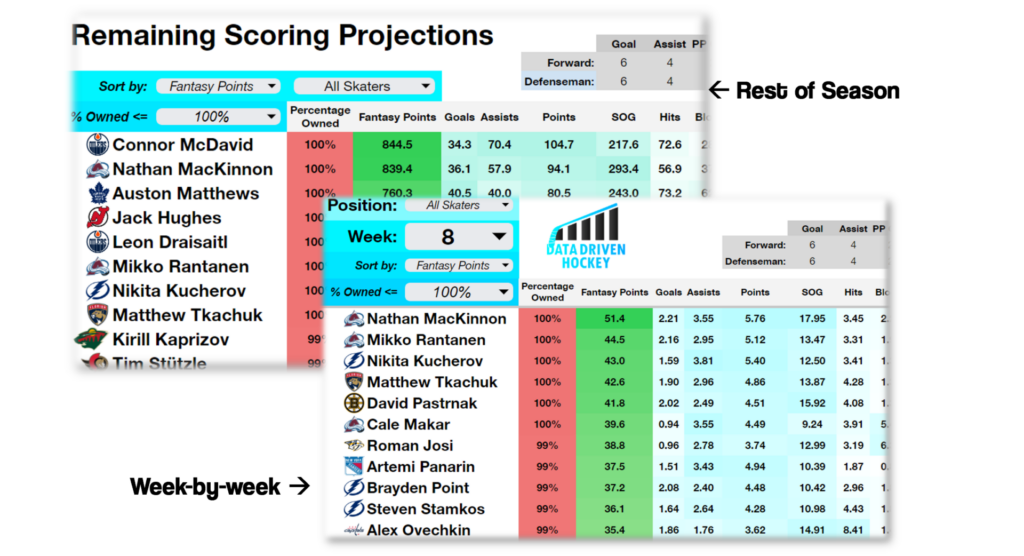
Comprehensive Projections
Week-by-week and rest-of-season data-driven projections for over 800 NHL skaters and 65+ goalies across 14+ categories, including goals, assists, points, shots on goal, hits, blocks, plus/minus, powerplay goals, powerplay assists, power-play points, power-play shots on goal, penalty kill goals, penalty kill assists, and penalty kill points.
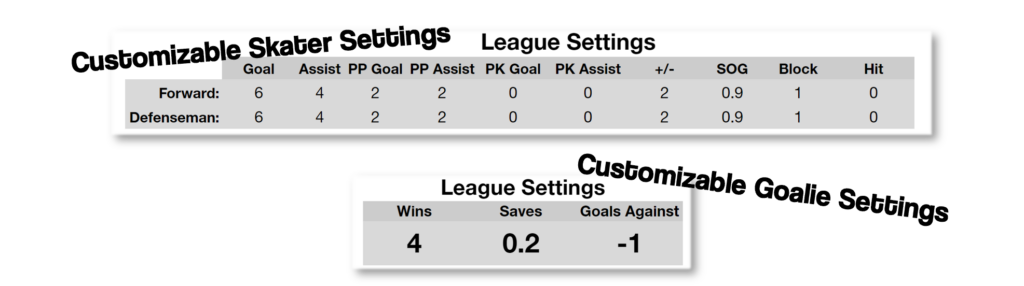
Customization For Your League
Tailor the hub to your league’s settings by customizing fantasy point calculations to match your league’s scoring system.
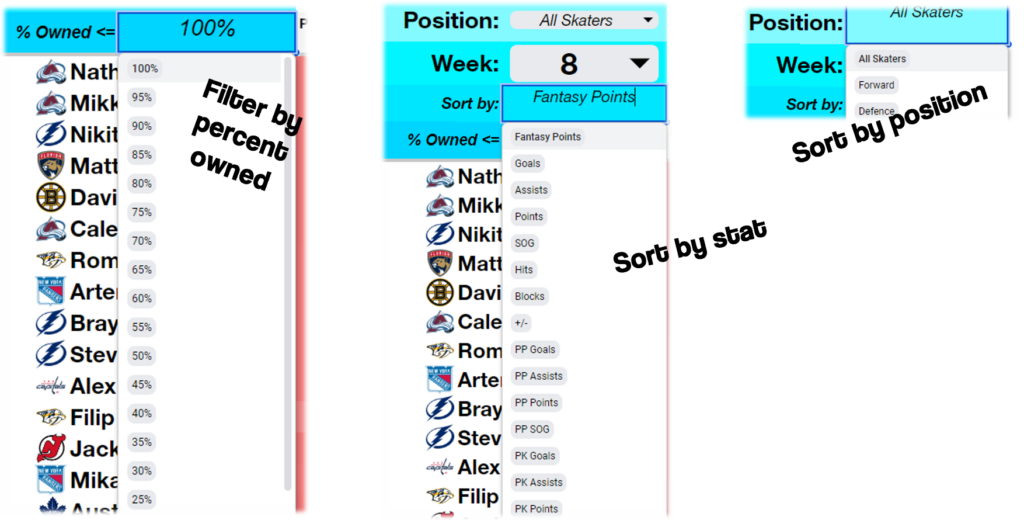
Filtering/Sort Options
Streamline your waiver-wire search with filtering capabilities based on position and percentage owned. Sort by any of the 14 categories to uncover hidden gems that align with your team’s needs.
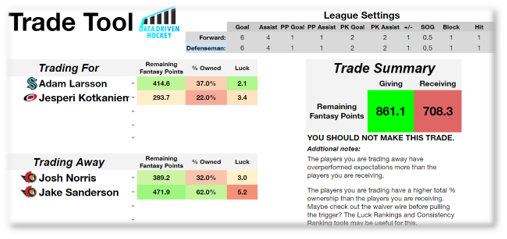
Trade Analyzer
Evaluate potential trades and assess their impact on your team’s performance before making crucial decisions.
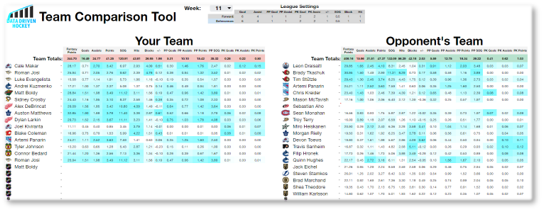
Roster Comparison Feature
Gauge the strength of your roster against opponents by inputting both rosters into the comparison tool. Analyze results across all 14 stat categories and overall fantasy points, giving you a strategic edge for every week’s matchup.
Team Season Projections and Performance Metrics
There are two Google Sheets in the Expected Goal Scorer Perks folder that fall into this category, Team Projections and Power Rankings and 2024-25 NHL Team Stats. Both of these sheets are updated every morning with the latest model outputs and data
Team Projections and Power Rankings
This sheet contains four tabs:
- Season Projections. This tab contains the latest NHL season projections from GPM2, including projected wins, losses, overtime losses, points and playoff/stanley cup probabilities.
- Team Cards. This tab contains cards that show a line-by line breakdown of each team, as well as their goaltenders with their Goals Over Average rating. The cards also show the probability that each team will finish 1st, 2nd or 3rd in their division and the probability that they finish in a wildcard spot.
- Playoff Probs Tracker. This tab displays a table of playoff chances over the past week, as well as pre-season playoff chances.
- Power Rankings. This tab contains the datadrivenhockey power rankings and power ranking cards. The power rankings are the output of a multi-layer perceptron neural network model. The weekly power rankings post on instagram explains how the model works.
2024-25 NHL Team Stats
This sheet contains two tabs:
- Unconventional Team Rankings. This tab contains NHL team rankings for the current season. The rankings are split into two sections – percentage stats and counting stats. Examples of percentage stats: xGF%, Win Percentage vs. Best/Worst Teams, Net Miss Percentage, etc. Examples of counting stats: expected goals per game played, shot quality, PDO, etc.
- Head-to-Head. This tab has an interface for comparing two NHL teams across many key stats. There are dropdown menus for selecting the teams and the team with an edge in each stat is highlighted in green. The stats are: xGoals Per GP, Goals Per GP, Shot Quality For, Finishing, PP Goals Per GP, xGoals Against Per GP, Goals Against Per GP, Shot Quality Against, Goaltending (xGA/GA), PK Goals Against Per GP, 5v5 xGoals %, Pts % vs. Top Teams, Pts % vs. Bottom Teams.
Player Skill Evaluations: Goals Over Average (GOA)
There are 3 different types of player GOA cards available in the Expected Goal Scorer Perks folder:
- Skater Cards – Projection and In-season Performance Cards (for the current season) for all NHL forwards and defensemen
- Goalie Cards – Projection and In-season Performance Cards (for the current season) for all NHL goalies
- Historical Skater Cards – In-season Performance Cards for all NHL forwards and defensemen dating back to the 2007-08 season
The below sections give some background on the GOA model behind the cards and describe how to read the cards.
Skater GOA
GOA is a metric designed to measure and project the goals per 60 differentials of NHL skaters. GOA evaluates a skater’s proficiency in the five most important areas of the game: even-strength offense, even-strength defense, powerplay offense, penalty kill defense, and penalty differentials. A skater’s total GOA is a weighted sum of their skills in these areas. GOA offers a comprehensive view of a skater’s contribution to their team through a nuanced data-driven evaluation that surpasses traditional metrics.
Reading the Skater Cards
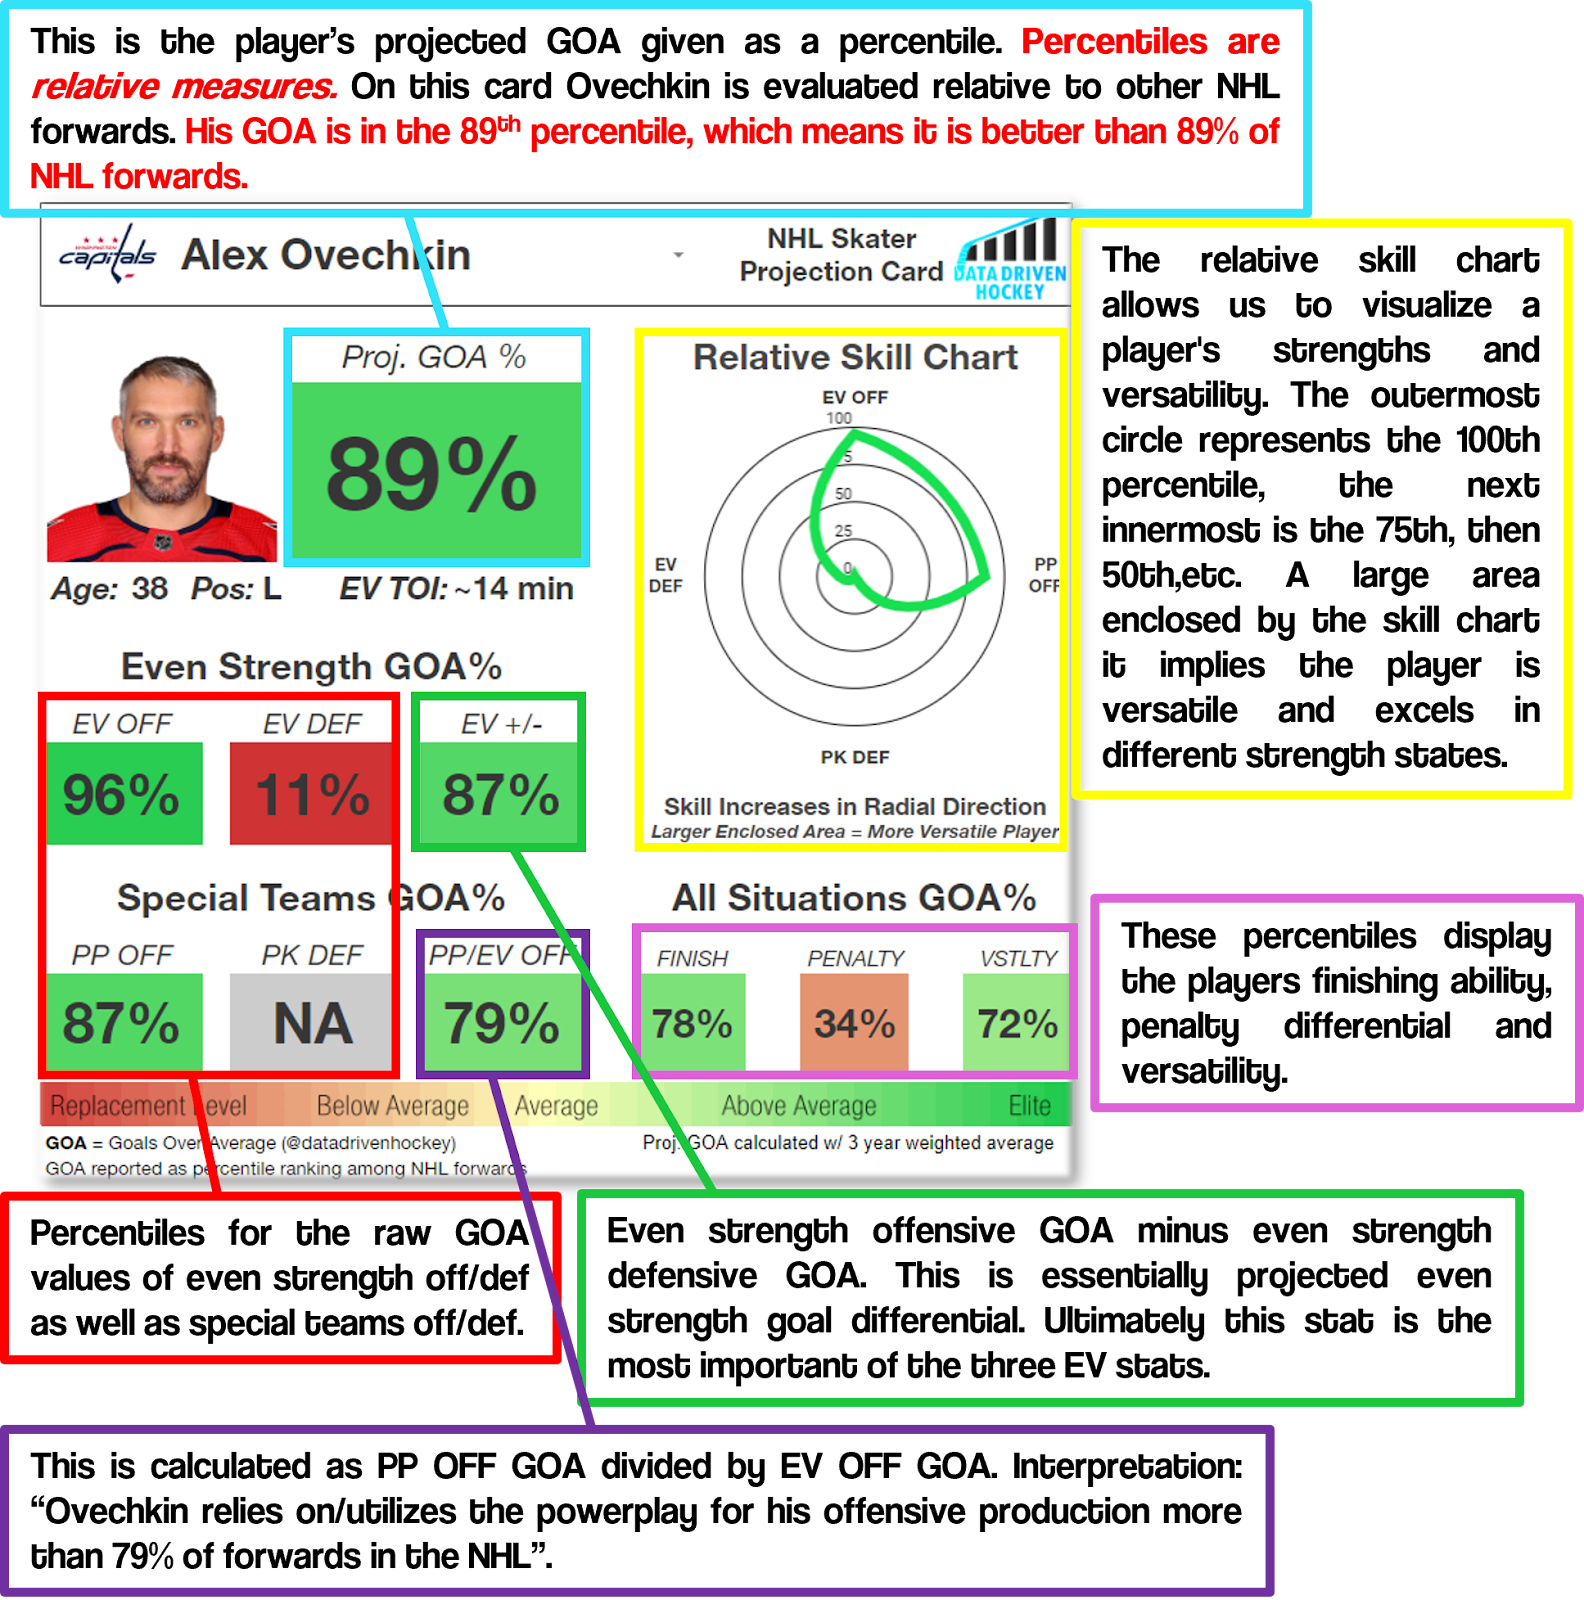
Percentiles Explained
Percentiles are relative measures. On the player skill cards players are evaluated relative to other players at their position. Higher percentile rank means better performance. For instance, a player in the 90th percentile is performing better than 90% of others in the same category. For example, if Slavin is in the 99th percentile for even strength defense, this means he is better at even strength defense than 99% of the other players in the dataset (NHL defensemen).
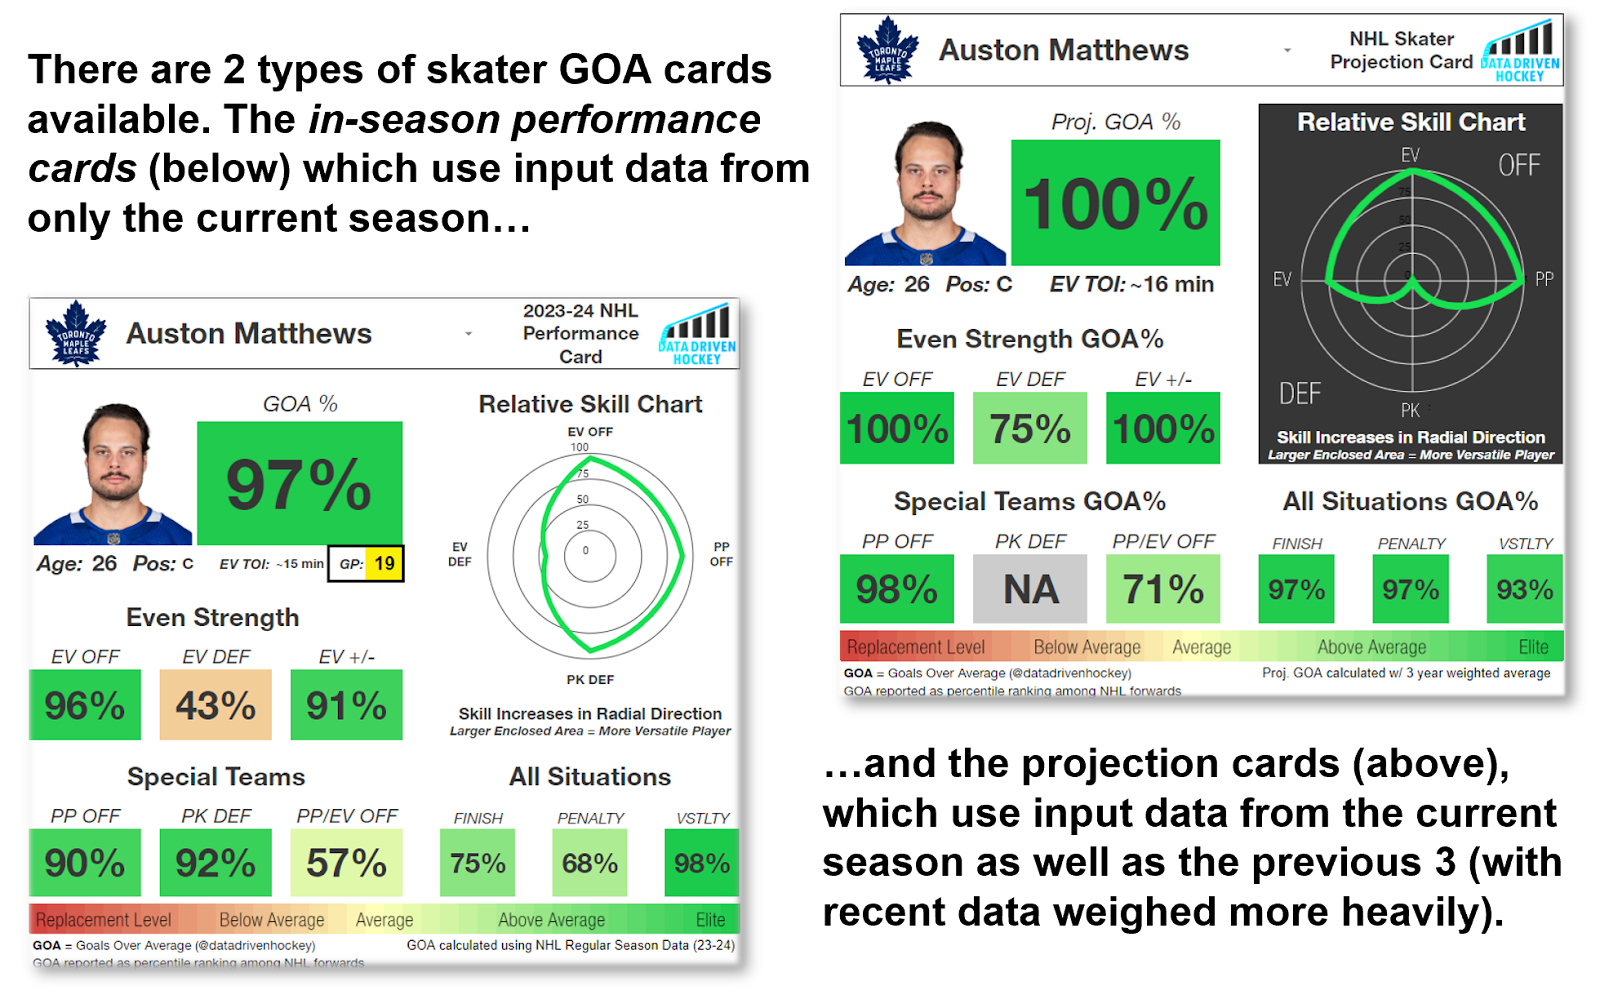
In-season vs. Projection Cards
The Projection Cards consider multiple years of historical data to provide a forward-looking glimpse into a player’s potential impact. The In-Season Cards capture the immediacy of a player’s current performance by relying solely on data from the ongoing season. While these cards offer a snapshot of a player’s recent achievements , it’s important to acknowledge the smaller sample size, recognizing that fluctuations in performance may be more pronounced. Using the projection and in-season cards together allows us to appreciate both the long-term trajectory and immediate contributions of NHL players.
Versatility Explained
The Versatility Score is a unique metric designed to encapsulate a player’s multifaceted skills on the ice. By summing the percentile ranks across four key categories—Even Strength Offense, Even Strength Defense, Penalty Kill Defense, and Power Play Offense—the Versatility Score provides a holistic view of a player’s capabilities in both offensive and defensive situations. A higher Versatility Score indicates a player who excels both offensively and defensively across a range of strength states. This metric offers a nuanced understanding of a player’s well-rounded impact on the game and provides insights into the diverse strengths that players bring to the ice.
Goalie GOA
GOA-for-goalies is designed to measure and project a goaltender’s impact on their team’s goal differential. GOA provides insights that transcend traditional metrics, considering not just the quantity but the quality of shots faced. By accounting for shot context we can gain a deeper understanding of a goalie’s impact on the game.
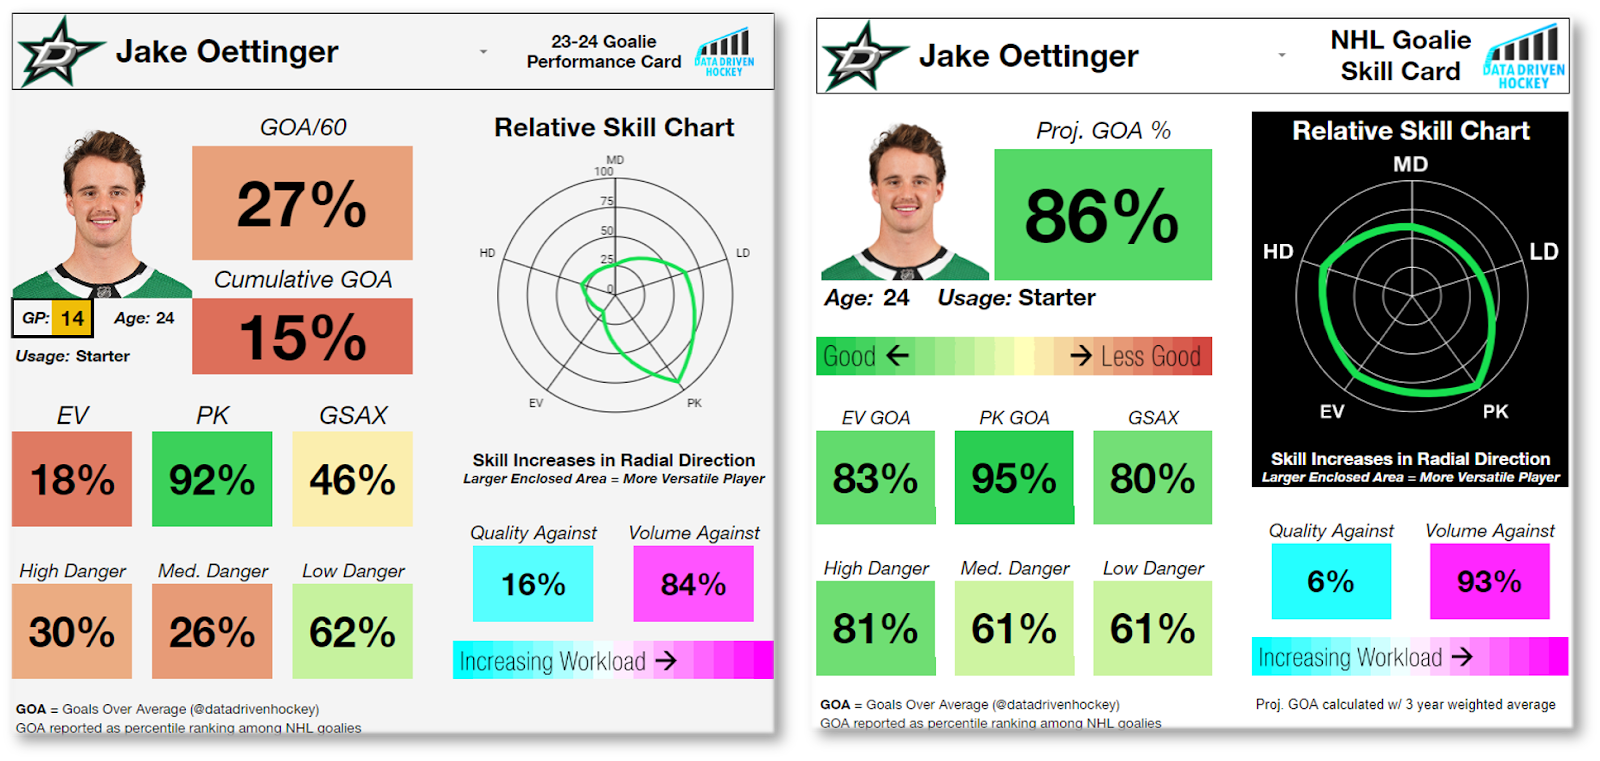
Like for the skaters, there are TWO types of goalie GOA cards available. The in-season performance cards (above – left) which use input data from only the current season and the projection cards (above – right), which use input data from the current season and the previous 2 (with recent data weighed more heavily).
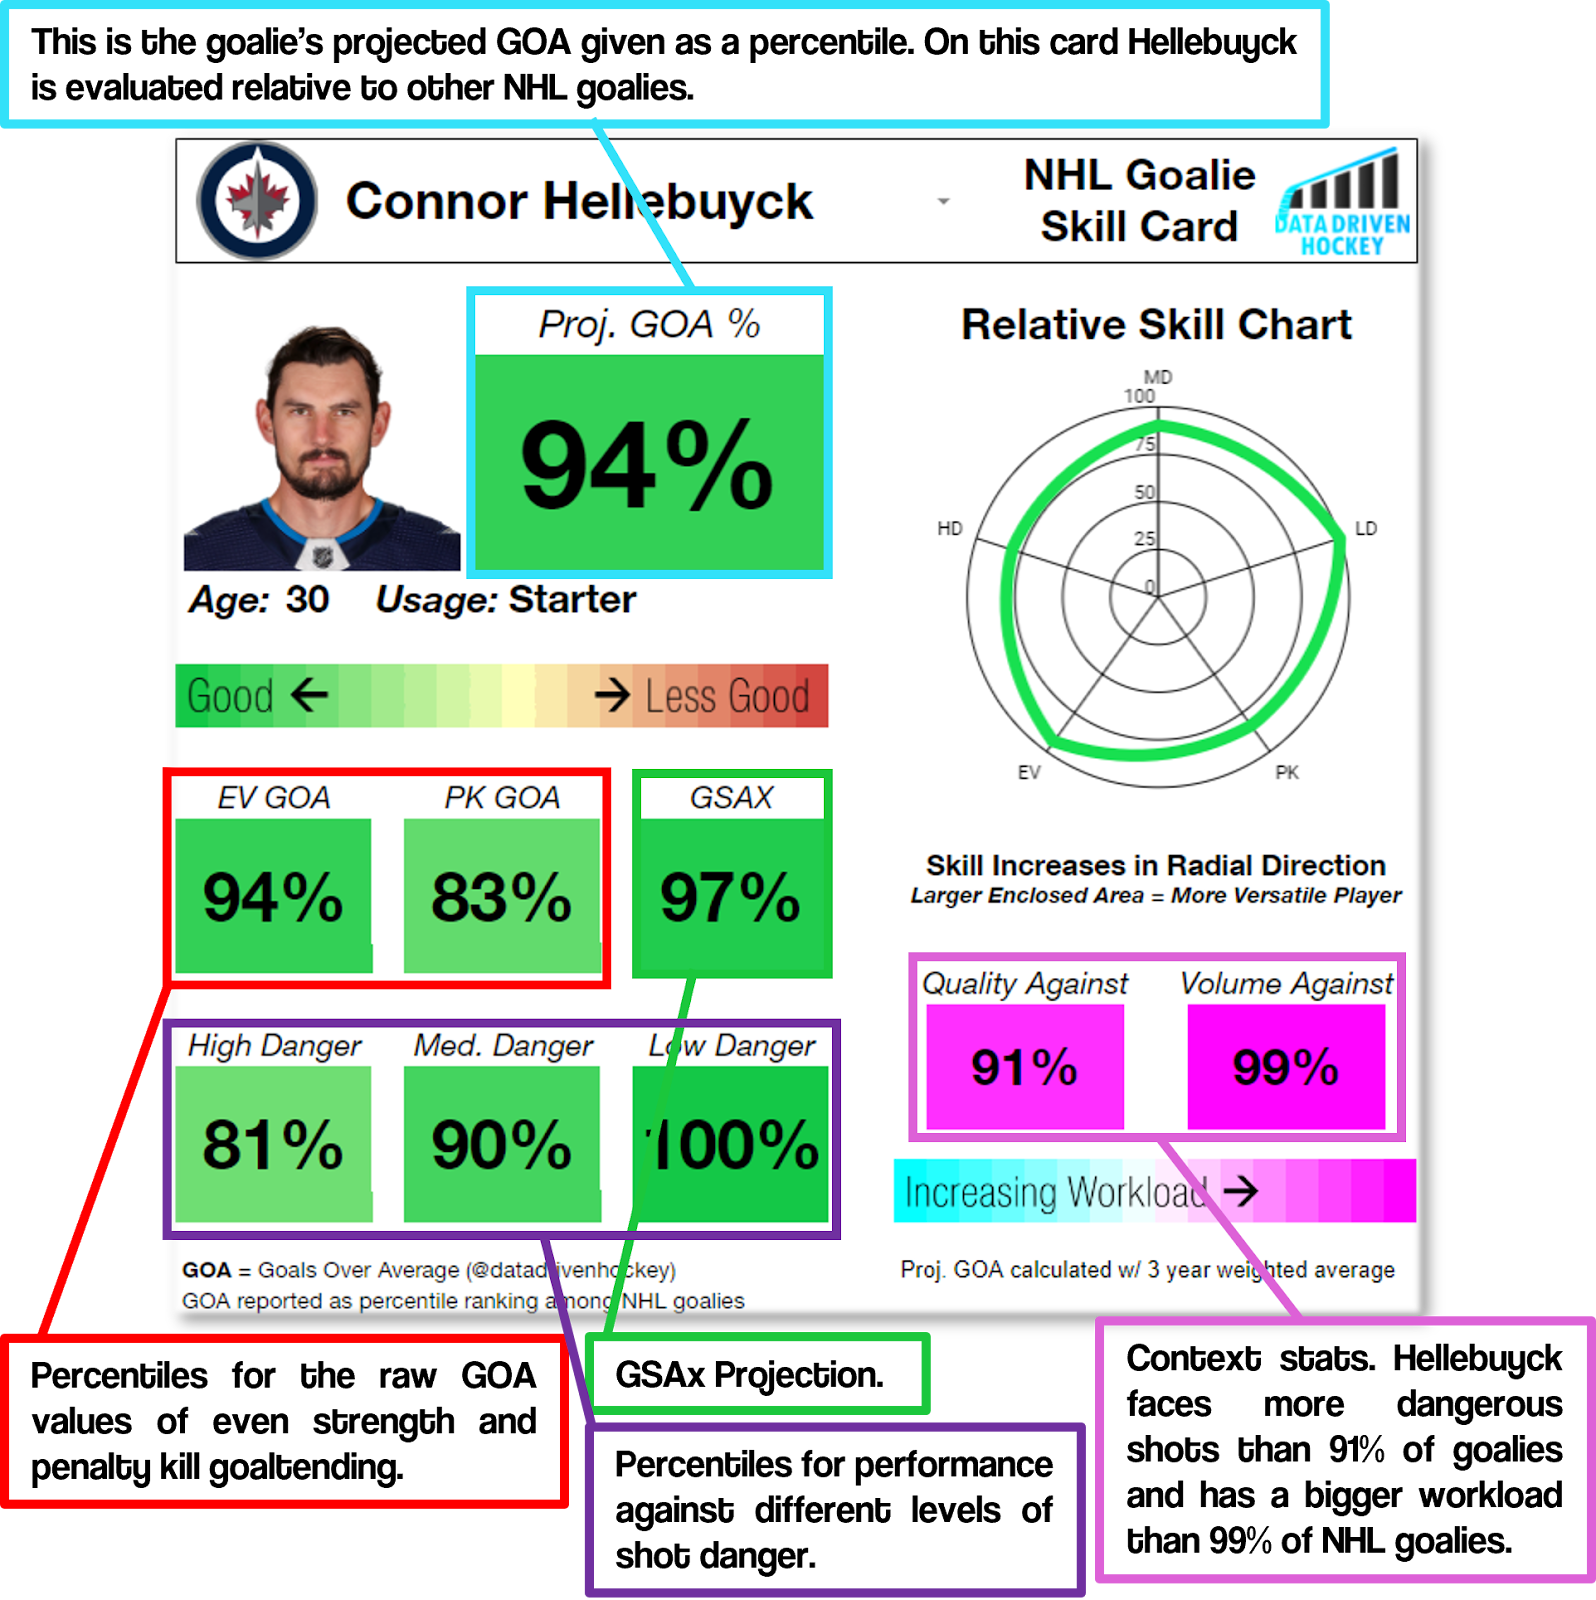
Reading the Goalie Cards
Player Production Projections
This Google Sheet contains full-season production projections (i.e., projected number of goals, assists and points) for all NHL skaters. The production projection model uses up to 3 years of historical data to project future on-ice and personal shot rates, shot quality, shooting percentage, IPP/assist rates, etc. The entirety of the NHL season is simulated game-by-game 3000 times and projected icetime, linemates and competition are accounted for in the simulations.
There are 5 tabs on this sheet:
- Production Cards. This tab contains cards where you can select any NHL skater and see a breakdown of how they are expected to produce this season. The breakdown includes:
- Their most likely, maximum and minimum goal, assist and point totals
- Their probabilities of winning the Art Ross and Rocket Richard trophies
- Histograms of their projected point, goal and assist totals
- Their probabilities of hitting goal, assist and point milestones
- Projected Leaderboards. This tab contains a ranked list of NHL skaters based on their projected end of season point, goal and assist totals. It is sorted by points.
- Rocket Richard Probabilities. This tab contains a list of NHL skaters ranked by their probability of winning the Rocket Richard trophy.
- Art Ross Probabilities. This tab contains a list of NHL skaters ranked by their probability of winning the Art Ross trophy.
- Assist Leader Probabilities. This tab contains a list of NHL skaters ranked by their probability of leading the NHL in assists.
Expected Goal Scorer Pro Tier
14.00 USD/month
Fantasy Hub Pro
The Fantasy Hub Pro includes all the features of the Fantasy Hub, but it…
- Is personalized to only YOUR fantasy team
- Includes advanced strategy tools
- Is powered by a more sophisticated model
Extreme Personalization
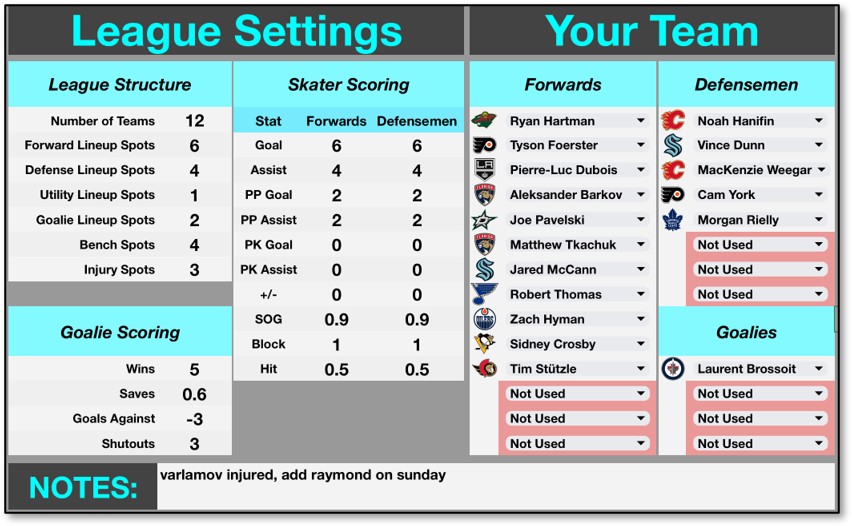
Enter your league settings and team roster in a central location and it will automatically integrate with the other tools. Your league scoring settings will populate in the projection sheets, your roster will populate in the team comparison tool and the league structure settings will be used along with your team lineup in the pro Weekly Breakdown Tool, a game changing resource for optimizing your fantasy lineup.
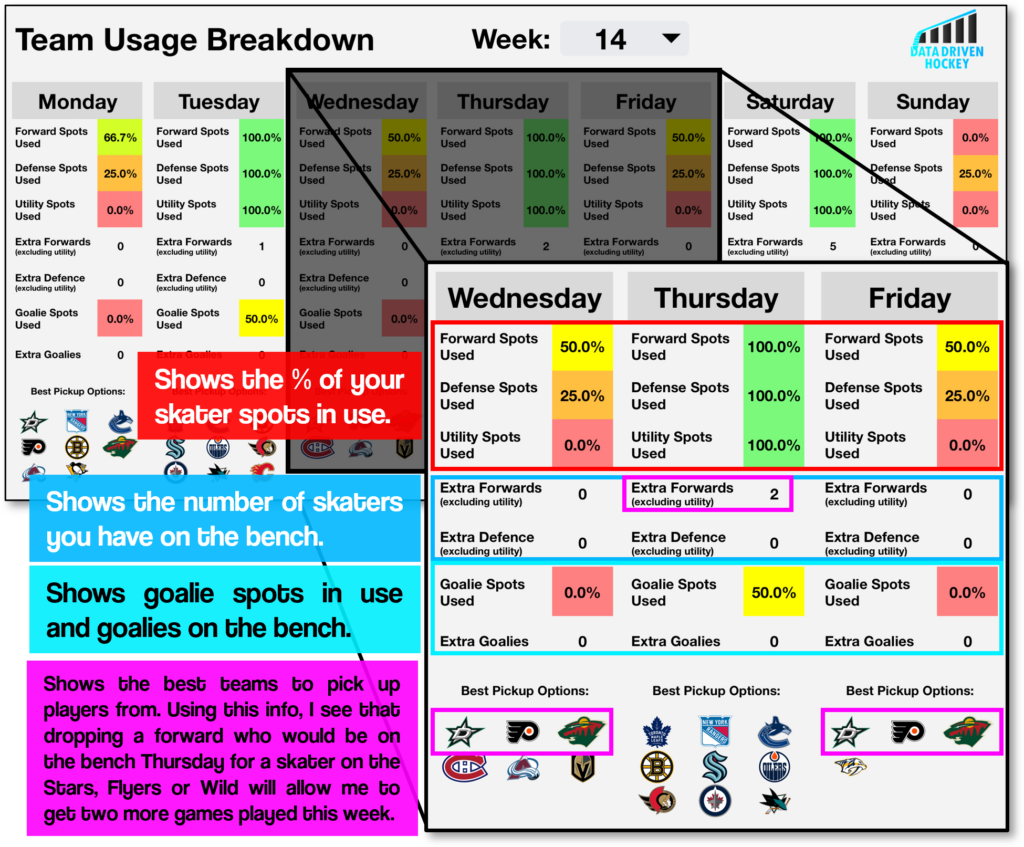
Weekly Breakdown Tool
The weekly breakdown tool reports your lineup utilization for each day of the week. Utilization is broken down by position so you can easily see where you are lacking and where you have extra players. If you don’t have a full lineup for a given day it suggests which teams to scout, sorted by number of games teams have that week.
Team Summary Tool
This tool is self-explanatory: it shows you a quick snapshot of your fantasy team, including their average projected points production, their point production in the selected week and their recent usage.
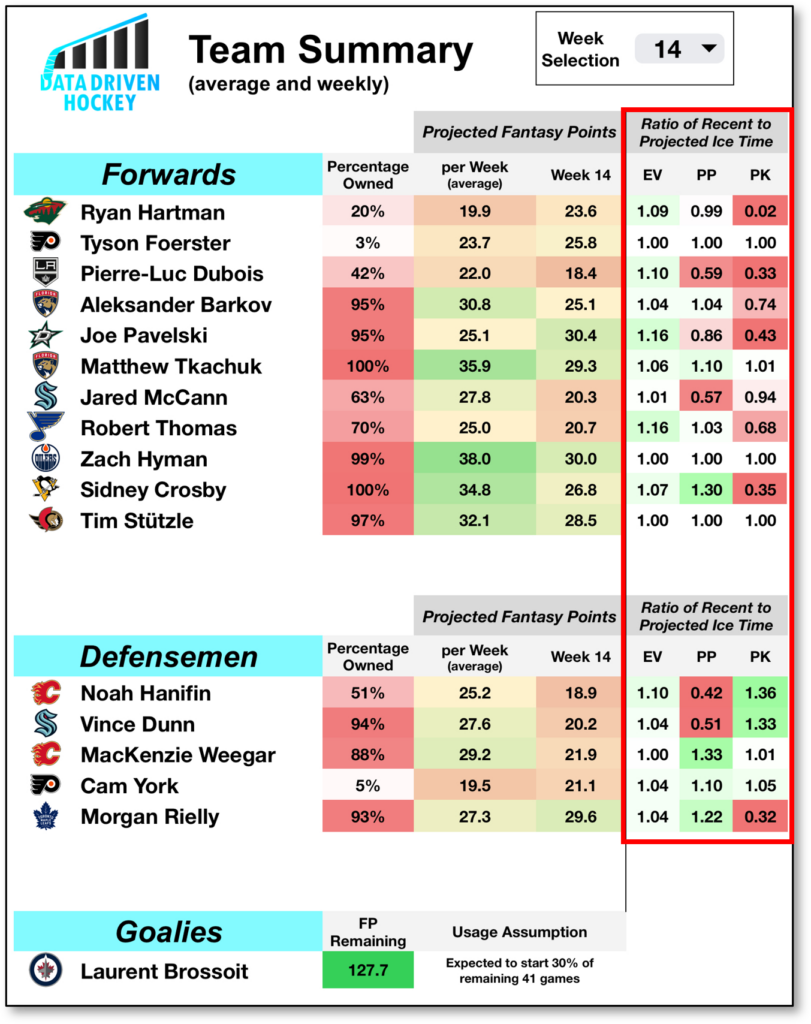
The “ratio of recent to projected ice time” shows how much a coach has been using a player in the recent weeks compared to how they are projected to be used based on their history – the key thing here is that the projected usage is what is used in the fantasy point projection calculations. For example, due to his poor play this year, Pierre-Luc Dubois has lost the trust of his coaches on special teams. If we don’t account for this, we will overpredict his fantasy point production.
Accounting for Usage Changes
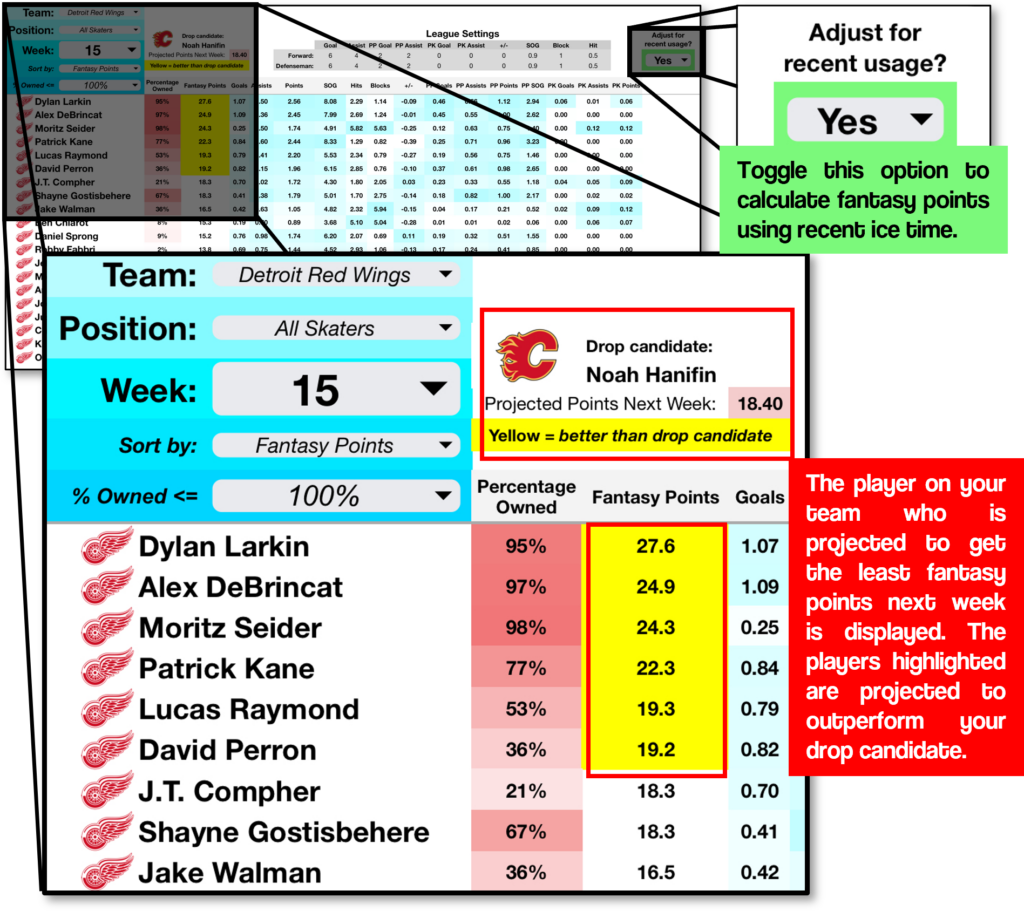
The Fantasy Hub Pro’s weekly skater ranking tool comes with some upgrades: you can filter by team, see which member of your team is best to drop and calculate fantasy points using recent ice time rather than projected ice-time!
Game Probability Hub Pro
The Game Probability Hub Pro offers the exact same probabilities as the regular Game Probability hub, with 2 key upgrades:
- You can change the date to see all the probabilities for the current day’s games as well as the next 10 days worth of games.
- It is only shared with you – no one else will change any settings while you are using it.
Expected Goal Scorer Elite Tier
20.00 USD/month
Value Vault
The Value Vault tool sifts through the daily NHL lines and reports the lines with an edge according to the model (GPM2). While the same model that is available in the less expensive tiers is used for the probabilities, the benefit of the Value Vault is that it saves you time – you don’t have to manually compare the model outputs to sportsbooks because the Value Vault does the work for you. Just like the other probabilities, the Value Vault updates every 3 hours to include the latest lineup, starting goalie and betting line information available.
The Value Vault finds value picks in the following categories:
- Money Line
- Game Total Over/Unders
- Player SOG Over/Unders
- Player Assist Over/Unders
- Player Point Over/Unders
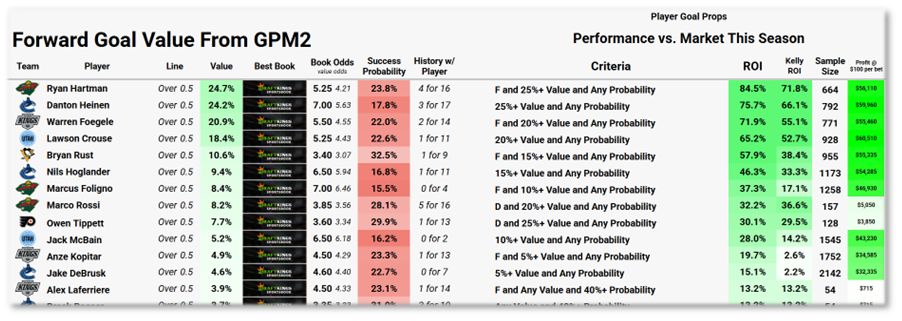
- Anytime Goal Scorers
You can see a detailed performance summary here: Value Vault Performance.
The Value Vault is available as both a Google Sheet (request access here) and as a page on the DataDrivenHockey website (sign in with your Patreon credentials).