
Welcome to another edition of the Hockey Handbook series! In this installment, we’re introducing some of the most common team statistics. If you are a long-time hockey fan you are probably already comfortable with these stats but, if you want a refresher, keep reading! If not, click HERE to browse through other Hockey Handbook entries.
Goals and Shots
A team scores a goal when the puck legally enters the opposing teams net. I’m not going to get into the intricacies of what constitutes a legal goal, because that water can get muddy – the topic deserves its own article. Goals For are the sum of the goals a particular team scores over the sample size of interest (e.g., a single game, month, season, or multiple seasons) and Goals Against are the sum of the goals a particular team has scored against them over the sample size of interest.
Shots For and Shots Against are analogous with Goals For/Against, obviously with goals replacing shots. The team-centric definition of a shot is the same as the player-centric definition: A team is awarded a shot if a player on the team shoots the puck and they either; (1) score, or (2) the opposing goalie stops them from scoring (i.e. makes a “save”). Thus, if the player shoots and the puck misses the net, is blocked by an opposing skater, or hits the post the team is not awarded a shot.
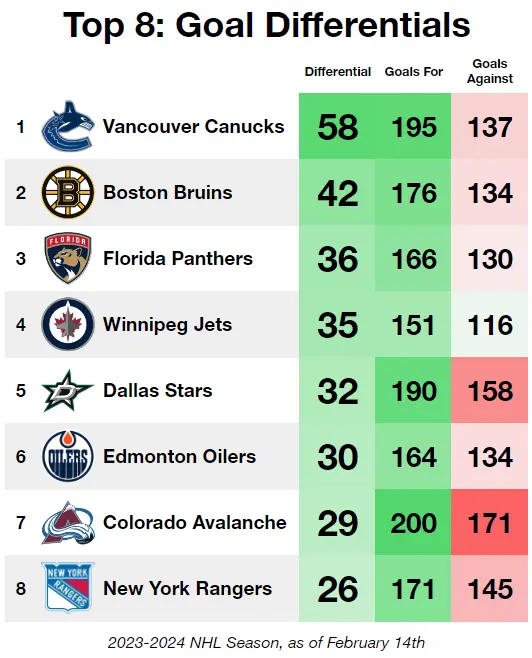
Raw goal and shot numbers are interesting on their own, but you can take your analysis one step further by calculating differentials. Goal differential refers to the difference between a team’s Goals For and Goals Against (shot differential is similar, just swap in shots for goals). Calculating goal differentials is an easy way to check if a team is accomplishing every hockey teams main goal – outscoring their opponents – over larger sample sizes than a single game.
Shooting Percentage and Save Percentage
Analogous to a player’s shooting percentage, a team’s shooting percentage is their total goals divided by their total shots. Similarly, a teams save percentage is simply their goalies’ total saves divided by shots against.
Why do we differentiate a team’s save percentage from that of their goalies? Good question. NHL teams always have at least two goalies play games for them in a single season. Goalie is a physically demanding position and even the best of them need to rest every once in a while. It is also not uncommon for a team to use multiple goalies in a single game if the starting goalie gets injured or is performing poorly.
Shooting percentage and save percentage are cornerstones in most discussions of “luck analysis” in hockey, so expect us to revisit them frequently in the future.
Powerplay and Penalty Kill Percentage
If a player breaks a penalizable rule, their team is given a penalty by the referees. It is more complicated than that in practice – lots of analysis’ have shown that factors other than rule breaking have a large impact on the frequency and number of penalties handed out. But I digress… that is a discussion better suited for a future Hockey Handbook entry.
Penalty calls usually result in the non-penalized team getting at powerplay opportunity. However, some penalties – such as fighting majors – offset each other and no powerplay is awarded to either team because a player from both teams is penalized.
A team with a powerplay opportunity has more skaters on the-ice than their opponent, who is attempting to “kill” the penalty. A penalty is successfully “killed” if the team with the powerplay does not score for the duration of the penalty (usually 2 or 5 minutes). If the team with the powerplay (or man-advantage) does score during the powerplay then the powerplay is considered successful and the penalty kill is not. Powerplays that resulted from minor penalty (2-minute penalties) calls terminate if a goal is scored, whereas powerplays resulting from major penalty (5-minute penalty) calls do not.
A teams powerplay percentage is their successful powerplays divided by their total powerplays, and their penalty kill percentage is their successful penalty kills divided by their total penalty kills.
Wrapping Up
Here is a quick, point-form summary of the key team stats touched on in this article:
- A goal is scored when the puck legally enters the opposing team’s net, with Goals For representing a team’s total scored and Goals Against indicating goals scored against them.
- Shots For and Shots Against mirror Goals For/Against, with shots awarded for scoring attempts that either result in a goal or are stopped by the opposing goalie.
- Differentials, such as Goal Differential (difference between Goals For and Goals Against), can shed light on average performance over larger sample sizes.
- A team’s shooting percentage is the ratio of their total goals to total shots.
- A team’s save percentage is the ratio of all their goalie’s total saves divided by all shots against.
- Penalties lead to powerplay opportunities for the non-penalized team, where they have more skaters than the “penalty killing” opponent
- A team’s powerplay percentage is calculated as successful powerplays divided by total powerplays, while the penalty kill percentage is determined by successful penalty kills divided by total penalty kills
I hope you enjoyed this introduction (or reminder) of conventional team stats! Click HERE to browse through other Hockey Handbook entries.
Leave a Reply